
Academic Technology, a department within the Division of Information Technology (DoIT), advances the University of Wisconsin–Madison’s mission and strategic priorities as well as the Wisconsin Idea by providing innovative and sustainable services that support teaching, research, learning and inclusion throughout the university community.
Who we are
Since our creation in the 1990s, DoIT Academic Technology (DoIT AT) has been a valuable leader and partner for numerous technological initiatives in the teaching and learning ecosystem. Our flexibility and innovation enable AT to meet the changing needs of the university and the increasing demands for instructional technology.
Our team of professionals design, develop and support technology-enhanced experiences for today’s learners. Through initiatives like the Information Technology Academy (ITA) and our university partner projects, we serve residential learners as well as precollege and lifelong learners.
Learn@UW–Madison
The Learn@UW–Madison team manages and supports the Learn@UW suite of learning technologies that facilitate teaching and learning at UW–Madison. The team provides technical support, training, consultation and documentation for all tools in the Learn@UW suite.
In addition to handling operations for our widely used academic technology tools, Learn@UW–Madison staff contribute technical and strategic expertise to a range of UW–Madison initiatives, committees and partnerships, such as support for online employee training course deployments, participation in teaching and learning technology pilots and partnership with the Instructional Technologist Group (ITG).
Learning Analytics Center of Excellence
The Learning Analytics Center of Excellence (LACE) is a dynamic data team. The professionals in this service provide expertise on leveraging teaching and learning data to better support educational practices on campus through:
- Support of data-empowered educational practices, including learning analytics
- Stewardship of the teaching and learning data domain
LACE collaboratives on strategic teaching and learning data initiatives aimed at sustained data-driven practices that maintain and enhance student learning. These strategic initiatives, prioritized by a broad range of campus partners, take place throughout the university, within and across schools, colleges, divisions and programs.
Center for User Experience
We partner with you to create more accessible, usable and inclusive digital spaces for all students, faculty, staff and members of the university community. We consult, design, research and evaluate digital content for the university.
Accessibility
We can evaluate the accessibility of digital technology for free. This includes products already in use on campus or products that are in consideration for purchase.
UX consultation
Partner with us for a project to improve your website, application or online service.
We can consult with you about accessibility and usability and what tools might help you.
More about the Center for User Experience
Software Training for Students (STS)
Software Training for Students (STS) is a free student-to-student technology training service that helps UW–Madison students learn practical technology skills from their peers in a comfortable, low-stress student-to-student format.
We offer hands-on learning through workshops taught by our student trainers, personalized technology training and support via 1‑on‑1 appointments, and tailor-made custom training workshops for instructors, student organizations, RAs, or small groups of students interested in new skills for class or personal projects.
We currently support Photoshop, Illustrator, InDesign, Premiere Pro, Audition, Excel, R, Python, Intro To Programming, HTML, CSS, and JavaScript, WordPress, and more!
All services provided by STS are available to any UW–Madison student free of charge.
Information Technology Academy
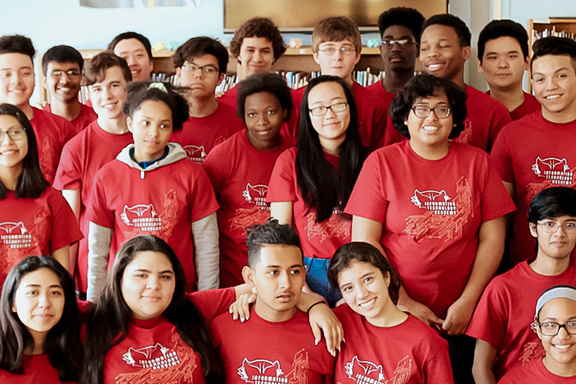
Information Technology Academy (ITA) is a precollege program that provides underrepresented high school students from the Lac du Flambeau, Madison and Oneida communities and surrounding areas the opportunity to reach their full potential through hands-on technology coursework, college preparatory academics and personal wellness development that supports their successful completion of high school and matriculation into higher education.
A primary goal of the ITA program is to prepare students to be competitive applicants for UW–Madison. Upon completion of the ITA program and acceptance to UW–Madison, graduates become PEOPLE scholars and are eligible to receive a 4-year, undergraduate, tuition-only scholarship to UW–Madison.
Project Management Group
The Academic Technology Project Management Group (PMG) provides consultation and project support on human change management efforts at the intersection of teaching, learning and technology. We believe that an inclusion-committed team results in high-value and transformational outcomes that improve the student experience. Established in 2014, the PMG applies proven project management tactics and strategic consultative guidance to support high-profile projects and cross-functional initiatives across campus.
![]()
What we do
The PMG plans and collaborates with stakeholders to ensure the appropriate resources are engaged to maximize project value. We take care of the team, so the team can take care of the project.
![]()
Who we serve
We specialize in understanding the complex academic landscape and working with campus leaders to serve university partners. Together, we craft a customized approach to each project in an effort to build momentum while delivering tangible value to stakeholders.
Academic technology news
List of articles

Microgrants in support of student success in online course content
Apply for a microgrant to explore how engagement with online course content impacts student performance. Deadline: Apr 21.
March 20, 2024Join colleagues for coffee & Copilot
Instructors: As you explore generative AI in teaching, drop into this series of informal Friday gatherings. Next session: Apr 26 via Zoom.
March 19, 2024Digital Accessibility Policy: implementation plan roadmap
The Digital Accessibility Policy aligns with UW–Madison and Universities of Wisconsin policies that protect people with disabilities against discrimination and honors our institutional statement on diversity. This roadmap tracks the implementation of the new policy over the life of the project.
March 15, 2024Enhancing usability with the Digital Accessibility Policy
At UW, we have a legal and ethical obligation to provide equal access to university resources for all. One way we can do this is by ensuring our digital resources are accessible. Accessibility is everyone's responsibility: Learn about the latest efforts in our shared journey.
February 20, 2024Take a DEEP dive into teaching and learning data for student engagement and success
The 2024-2025 theme for the microgrant program focuses on enhancing student learning by drawing on data to empower key educational practices. Faculty and instructors from all disciplines are encouraged to apply.
December 5, 2023- More Academic Technology News posts


Events, help, feedback
No events returned.
Schedule a consultation
There are a wide range of tools available and our learning technology consultants are happy to help you choose the best tool to fit your needs. Instructors and instructional staff can request a consultation with a DoIT AT consultant through the DoIT Help Desk.
Other questions or feedback?
We’d like to hear from you.