Teaching & Research Application Development (TRAD)
The Teaching & Research Application Development (TRAD) service partners with instructors, researchers and campus staff to conceptualize, design and implement innovative custom software solutions. We specialize in supporting campus teaching, learning and research ideas.
Our team provides the technical expertise to:
- Build solutions for research data collection, aggregation and sharing
- Design and develop proof of concept prototypes and fully developed applications in support of teaching and research innovations
- Create pedagogically sound games, simulations and data visualizations
- Design and develop custom websites
- Work with evaluators to identify and collect complex learning analytics
- Integrate new tools into or adapt current tools within the campus’ digital ecosystem
Contact us via email to discuss services, timelines and estimates.
Portfolio

CUWP

Rockd

Agefully

Badger Band

SMAHRT

Goals for Children

Q-TIP

STOMP

Symptom Clusters

Vector Records Repository

Johne’s Information Center

Spotted Owl Database

Student Grouping Tool

Center for Tobacco Research and Intervention Games and Quitting App

Nanodatabase

Farm2Facts

ACTIV

Clean Boats Clean Waters

Water Vapor Data Visualization
-
CUWP
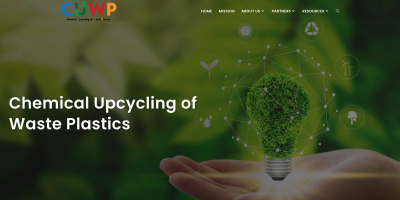
This project focuses on the creation of a WordPress website for a UW Department of Energy funded center called Chemical Upcycling of Waste Plastics (CUWP). The center consists of 7 universities, over 8 companies, 1 national laboratory and a non-profit.
Campus Partner
Department of Chemical and Biological Engineering
-
Rockd
Rockd allows users to explore and learn about the geologic record. The app includes access to geologic and geographic summaries of users’ current locations, provides interactive global access to geologic maps, and allows exploration of paleogeographic maps.
Campus Partner
Department of Geoscience
-
Agefully
Agefully is an evidence-based web application that connects family caregivers of older adults to research and expertise that helps them anticipate needs, explore options, prepare for likely future decisions, and improve the quality of life of older adults.
Campus Partner
Center for Aging Research and Education
Tech Highlights
- Custom-built content management system to manage site content
- App modifies content for the user to create a more personalized experience
-
SMAHRT
This tool collects data about adolescent screen time use and mood. Through a series of text messages sent to study participants, teens provided information about technology use, including whether they were using their phone when they received the text, what apps they were using, and a self-assessment of their current mood.
Campus Partner
Department of Pediatrics, Social Media and Adolescent Health Research Team (SMAHRT)
-
Goals for Children
The project focuses on custom development to assist families in setting goals for their child. Users select goals and provide a small amount of follow up information in Qualtrics. The app provides custom feedback based on their responses, including information about the goals they selected and a narrative of next steps. The custom feedback displays on the web page and can be downloaded as a PDF file.
Campus Partner
Department of Pediatrics
-
STOMP
This tablet-based application collects data from patients who have traumatic injuries in a hospital setting. The goal of the data collection is to assess the feasibility of adding the screening to the workflow in the trauma system. The application was used at four hospital locations in Wisconsin.
Campus Partner
Department of Family Health and Community Medicine
-
Symptom Clusters
This research application is designed to support the assessment of multiple, co-occurring symptoms experienced by patients with cancer, coordinate guideline-based recommendations for symptom management, and deliver instructions to help patients self-manage their symptoms.
Campus Partner
School of Nursing
Tech Highlights
- Mobile app with several types of user data collection using touch gestures
- Data visualization utilizing bubble charts
-
Vector Records Repository
This online repository enables the collection and reporting of data relating to the incidence of various species of mosquitoes in the upper Midwest.
Information collected within this database can be shared with other curators of regional and national data repositories.
Campus Partner
Midwest Center of Excellence for Vector-Borne Disease
Tech Highlights
- Custom, complex data entry capabilities for research data, including bulk upload from CSV files
- Large-scale data filtering of millions of records
- Custom roles and permissions for a variety of audiences
- Flexible data visualization, including map-based visualizations
-
Johne’s Information Center
The primary mission of the Johne’s Information Center is educating veterinarians and animal owners about Johne’s disease.
This project focused on redesigning the layout and information architecture.Campus Partner
Johne’s Information Center
Tech Highlights
- Interactive historical timeline
- Interactive quizzes
-
Spotted Owl Database
This tool was developed to facilitate data collection for the study of the demography of California Spotted Owls in the central Sierra Nevadas, including information about owl movement collected using GPS tags, acoustic samples, bio-samples, pellets, and DNA.
Campus Partner
Department of Forest and Wildlife Ecology
-
Student Grouping Tool
This tool was developed to support instructor growth in leading and facilitating classroom discussions.
It allows instructors to survey students about attitudes toward topics and basic demographic information.
The tool will then allow instructors to distribute students into discussion groups to maximize diversity.
Campus Partner
The Discussion Project, School of Education
Tech Highlights
- Custom-built, easy-to-use survey engine for instructors
- Allows for real-time, in-class surveys and grouping students based on their responses
- Includes graphs of student responses while maintaining anonymity of responses
-
Center for Tobacco Research and Intervention Games and Quitting App
The Center for Tobacco Research and Intervention team developed a study to measure cravings that users experienced before and after playing a game on a smartphone.
This app tracked how long the game was played and set limits on the amount of time between play sessions in accordance with study parameters.
Campus Partner
Center for Tobacco Research and Intervention
Tech Highlights
Android custom homescreen with built-in reporting capabilities
-
Nanodatabase
The Center for Sustainable Nanotechnology is a multi-institutional partnership devoted to investigating the fundamental molecular mechanisms by which nanoparticles interact with biological systems.
This web application allows for improved ways to share internal data among CSN participants.
The purpose of the site is to store data collected from multiple universities in a single location and to allow multiple approved users to access the data through the web.
Campus Partner
The Center for Sustainable Nanotechnology
Tech Highlights
Custom-built Ruby on Rails application
-
Farm2Facts
Designed by UW-Madison researchers, this app was created to help farmers market managers gather and interpret data.
Campus Partner
Kaufman Lab, Department of Planning and Landscape Architecture
Tech Highlights
- Allows users to upload data from CSV files
- Allows users to build custom infographic-based reports
- Integrates with payment systems
-
ACTIV
The ACTIV application supports research to collect data from caregivers of children with medical complexity.
By clinically monitoring caregiver confidence longitudinally in real time, researchers explore whether the potential exists not only to link it with downstream health outcomes, but also to target timely interventions to help caregivers at high-risk moments.
Campus Partner
Department of Pediatrics
Tech Highlights
- Research Data collection through text messages
- Data visualization using tables and charts
-
Clean Boats Clean Waters
The Clean Boats & Clean Waters application provides a method for volunteers to capture data and to educate boaters at water access points about invasive species regulations.
Campus Partner
WI Department of Natural Resources and UW Sea Grant
Tech Highlights
Android mobile app with location awareness and reporting capabilities
-
Water Vapor Data Visualization
This data visualization app helps students understand the water cycle and the role of water vapor.
Students can interact with the website to observe how insolation changes based on latitude and day of the year.
Students can also examine real data from the AOS department at the UW to see how sea surface temperatures, vegetation cover, evaporation and rainfall changed throughout the year.
Campus Partner
Soil Science, Atmospheric & Oceanic Sciences
Tech Highlights
Interactive websites with 3D visualizations
News
TRAD’s App Supports Adolescent Health and Technology Research
TRAD Provides Technical Solutions for Campus Researchers
More News
Helpful Guides
How does DoIT Academic Technology help instructors?
How do I get help with developing an app or website for teaching?
More Guides